Visual Capitalist |
| Mapped: Beer Consumption in the U.S. Posted: 29 Apr 2022 02:12 PM PDT Mapped: Beer Consumption in the U.S.Beer consumption spans almost the entire world, and is a staple in much of the United States. When stacked up next to other alcoholic beverages, beer is America's preferred drink of choice, closely followed by wine and spirits. In fact, it is the fifth most-consumed drink overall in the country, behind coffee, water, soft drinks and tea. At the end of 2021, beer in the U.S. was a $94.1 billion industry. Alongside massive multinational conglomerations, it is also driven by over 9,000 breweries of different types. This visualization, created by Victor Dépré of Hypntic Data, maps the consumption of beer by gallons per capita across the U.S. using data from Top Agency and The Beer Institute. What is Beer?Beer is produced from the fermentation of combined water, malt, and yeast. It was first produced 12,000 years ago with the emergence of grain agriculture. Today, beer is made from several different malted grains: wheat, corn, rice, oats, and most commonly, barley. Hops, a type of flower, are added for flavor, balancing out the malt's sweetness with a bitter taste while also preserving the beer's freshness and giving a good amount of foam. American Beer Consumption By StateSo which states drank the most beer, and what was their preferred brand? The annual consumption stats come from the Beer Institute’s Brewer’s Almanac report, while the preferred beer of choice was compiled by Data Agency’s 2021 Beer Rankings report, which is based on a combination of surveys combined with Google search analysis from all over the country.
New Hampshire took the top spot in 2020, outdrinking other states with 41.5 gallons of beer consumed annually per capita. In contrast, the lowest consuming state was Maryland which only consumed 19.7 gallons per capita, about half as much. The most popular beer? Despite the growing trend of craft breweries in some states, the most popular beer across the country was Budweiser of Anheuser-Busch, which took the top spot in 23 states. Which State Has The Most Breweries?Each state also has varying numbers of breweries operating within, and there are many different types. Larger breweries, including those run by some of the world’s largest companies, are also called macrobreweries. They are usually defined as having an annual production greater than 6 million barrels of beer, compared to craft breweries and other types of microbreweries which have a lower annual production. Craft breweries are also usually independently owned, and through both positioning and general perception, have come to be associated with specialties and originality, adding unique and interesting ingredients to traditional brews.
California has the highest number of breweries in the country, more than double any other state, at 1,466. On the flip side, Mississippi has the fewest breweries, with the most recent Beer Institute’s 2021 almanac only listing 26 in the entire state. Beer Sales During the PandemicSince the beginning of the COVID-19 pandemic in 2020, commonplace items saw massive spikes in sales across the world. As lockdowns were implemented and people were forced to stay at home, household items like toilet paper, soap, and pastas began to disappear from store shelves at alarmingly fast rates. Beer was no exception, and sales have continued to increase, going up by 8.9% in the U.S. since 2020. This is a worrisome fact to many researchers, as it could be a strong indicator that alcohol was used as a coping mechanism against anxiety and isolation felt during the pandemic. This rise could be a result of increased consumption, but may also indicate increased stockpiling. Regardless of why beer sales increased, it will be interesting to see which way the trend swings with the lifting of COVID-19 restrictions and the attempted return to normalcy in the months to come. The post Mapped: Beer Consumption in the U.S. appeared first on Visual Capitalist. | ||||||||||||||||||||||||||||||||||||||||||||||||||||||||||||||||||||||||||||||||||||||||||||||||||||||||||||||||||||||||||||||||||||||||||||||||||||||||||||||||||||||||||||||||||||||||||||||||||||||||||||||||||||||||||||||||||||||||||||||||||||||||||||||||||||
| Why Investors Tuned Out Netflix Posted: 29 Apr 2022 10:27 AM PDT
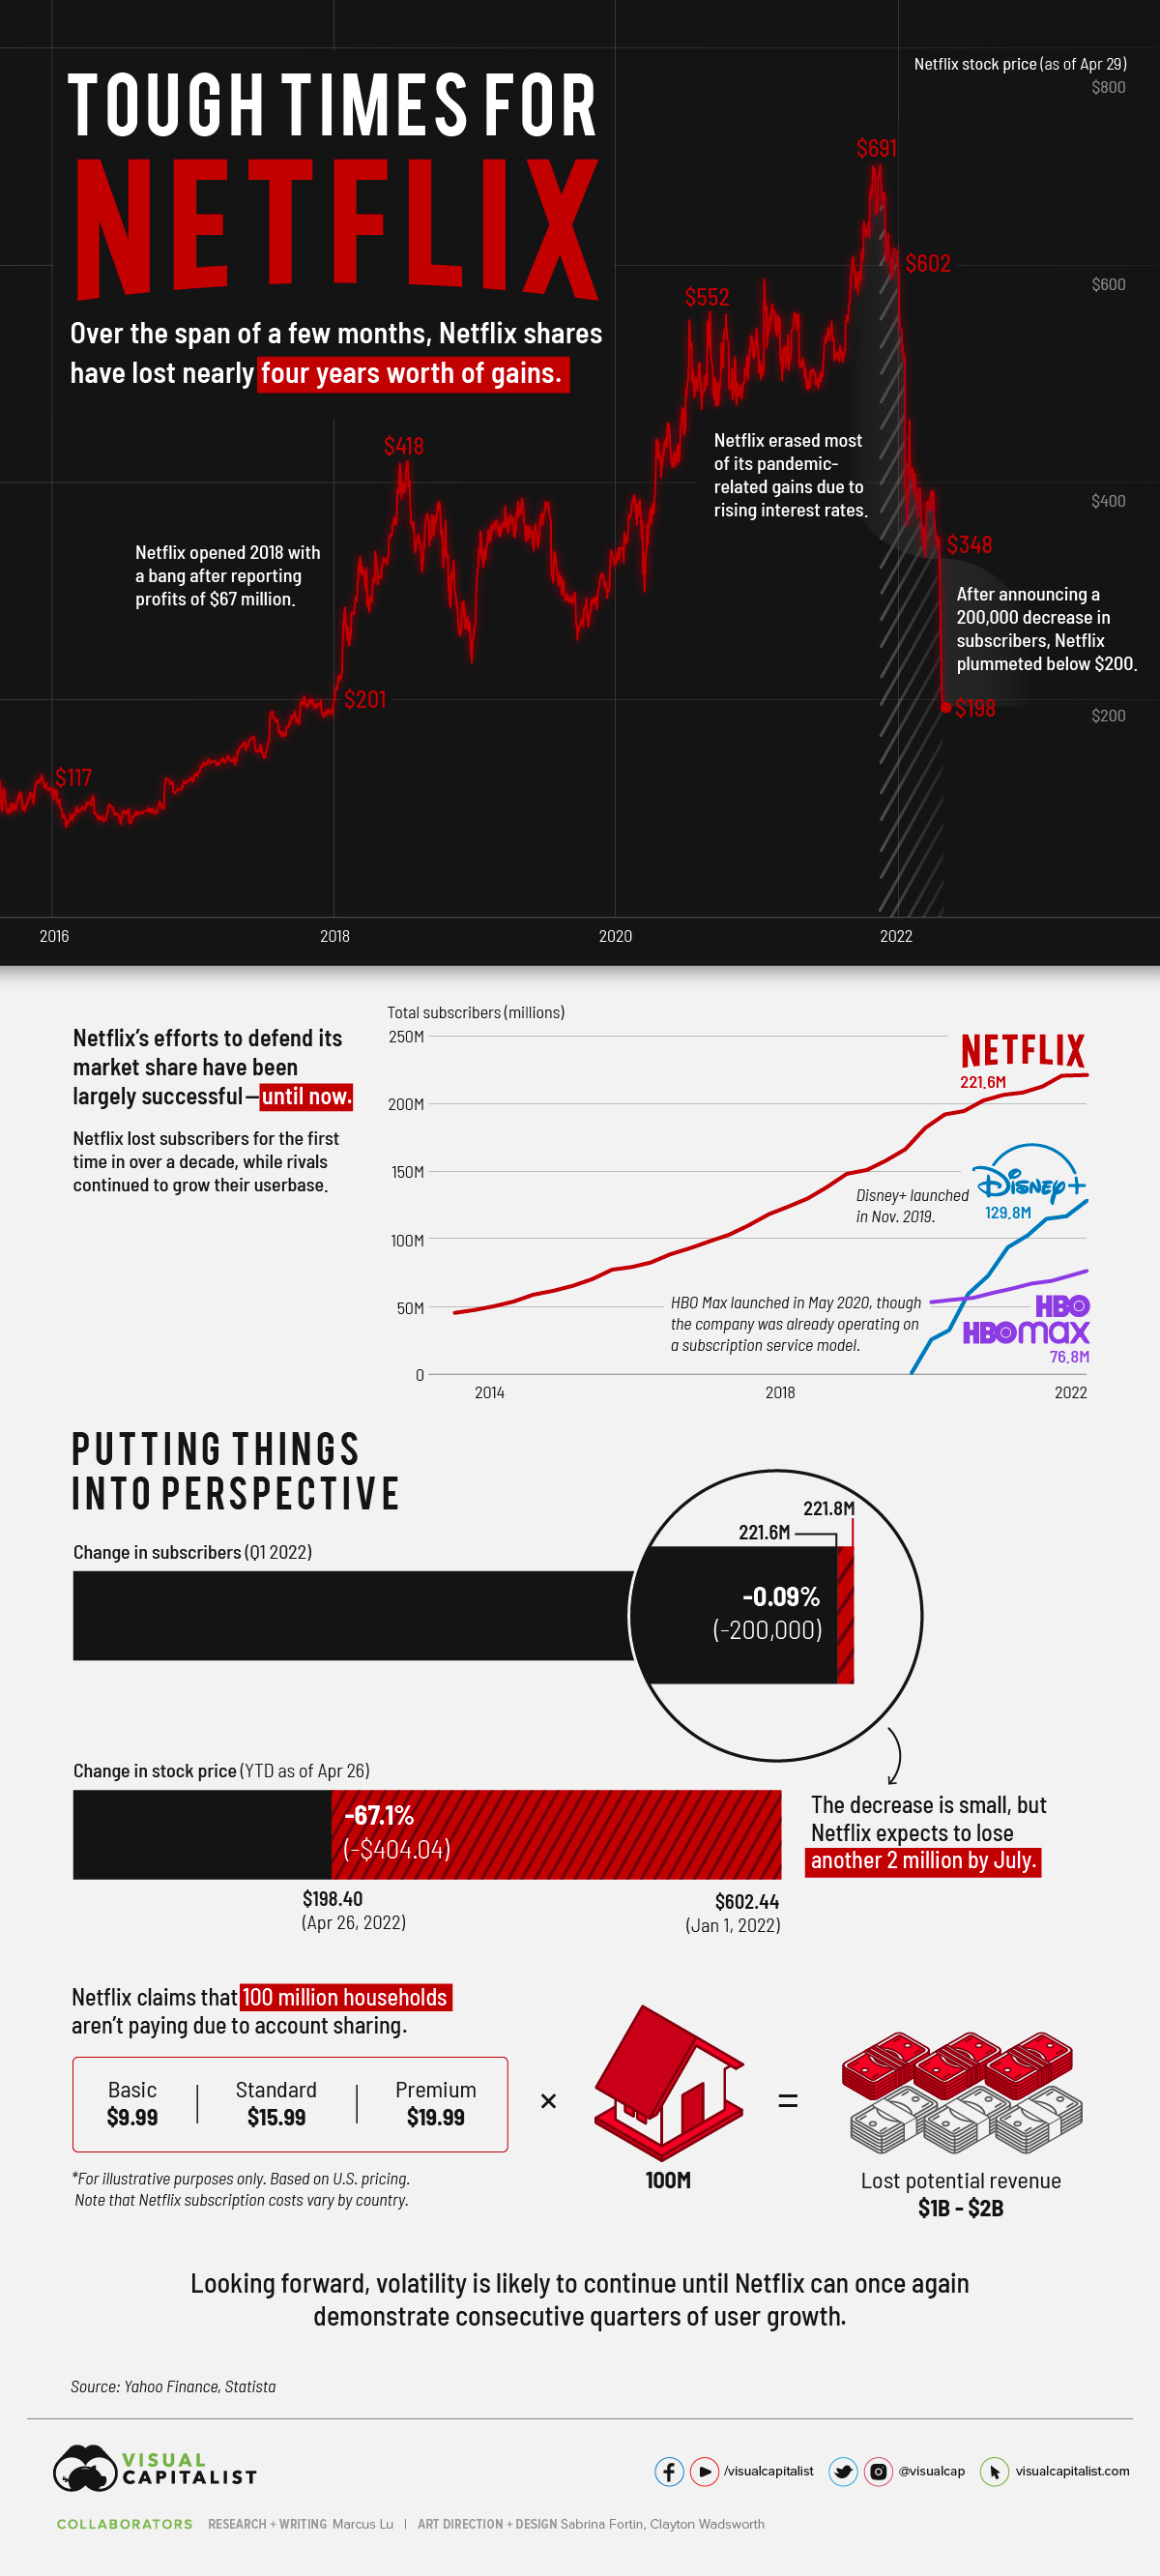
Why Investors Tuned Out NetflixNetflix shares have enjoyed an incredible run over the past decade. Subscriber growth seemed limitless, profitability was improving, and the pandemic gave us a compelling case for watching TV at home. Things took a drastic turn on April 19, 2022, when Netflix announced its Q1 results. Rather than gaining subscribers as forecasted, the company lost 200,000. This was the first decline in over a decade, and investors rushed to pull their money out. So, is there a buying opportunity now that Netflix shares are trading at multi-year lows? To help you decide, we've provided further context around this historic crash. Netflix Shares Fall FlatOver the span of a few months, Netflix shares have erased roughly four years worth of gains. Not all of these losses are due to the drop in subscribers, however. Prior to the Q1 earnings announcement, Netflix had lost most of its pandemic-related gains. This was primarily due to rising interest rates and people spending less time at home. Still, analysts expected Netflix to add 2.7 million subscribers. After announcing it had lost 200,000 subscribers instead, the stock quickly fell below $200 (the first time since late 2017). YTD performance (as of April 29, 2022) is an abysmal -67%. What's to Blame?Netflix pointed to three culprits for its loss in subscribers:
Let's focus on the latter two, starting with competition. The following table compares the number of subscribers between Netflix and two prominent rivals: Disney+ and HBO.
Disney+ was launched in November 2019, while HBO Max was launched in May 2020. HBO (the channel) and HBO Max subscribers are rolled up as one. Based on this data, Netflix may be starting to feel the heat of competition. A loss in subscribers is bad news, but it's even worse when competitors report growth over the same time period. Keep in mind that we're only talking about a single quarter, and not a long-term trend. It's too early to say whether Netflix is actually losing ground, though the company has warned it could shed another 2 million subscribers by July. Next is account sharing, which according to Netflix, amounts to 100 million non-paying households. This is spread out across the entire world, but if we use the company's U.S. pricing as a benchmark, it translates to between $1 to $2 billion in lost revenue. Growth is EverythingIn the tech sector, growth is everything. If Netflix can't return to posting consecutive quarters of subscriber growth, it could be many years before the stock returns to its previous high.
Regaining that momentum is going to be difficult, but Netflix does have plans. To address password sharing, the service may charge a fee for out-of-household profiles that are added to an account. The specifics around enforcement are vague, but Netflix is also considering a lower-priced subscription plan that includes advertising. Only time will tell if these strategies can stop the bleeding, or perhaps even boost profitability. Rampant inflation, which might persuade consumers to cut down on their subscriptions, could be a source of additional headwinds. The post Why Investors Tuned Out Netflix appeared first on Visual Capitalist. |
| You are subscribed to email updates from Visual Capitalist. To stop receiving these emails, you may unsubscribe now. | Email delivery powered by Google |
| Google, 1600 Amphitheatre Parkway, Mountain View, CA 94043, United States | |


No comments:
Post a Comment